Synchronizing the Date input component and multiple Historic charts
Goal:
Display trends on two chart components. Let there be one external component for the date selection instead of built-in date selectors of charts. We want that when one of the charts changes its scale, the corresponding date would be put in the date selection component and the same scale would be put on another chart.
Implementation:
Let's create a new form and open it in form designer:
Put the necessary components on the form - Date Input (it will be given the automatic name "WDateInput1"), Historic chart (it will be given the automatic name "WHistoricChart1").
Set up the properties of WHistoricChart1:
- hide the built-in date selection fields: in the property inspector set "chart".
Input enabledto "false". Hide reset zoom button: set "chart".Hide reset zoomto "true" - select a serie (you can click on the serie in the chart's legend). Using property inspector, select the tag, that is saved, to the "tag" property, by using the configuration tree (properties
Data source,Device,Tag nameshould be filled).
- hide the built-in date selection fields: in the property inspector set "chart".
Set up the logic of WHistoricChart1 (to do this, switch to the logic designer mode):
First, let's configure an event when the property of the selected dates in WDateInput1 changes, the selected range would be displayed in the WChartXAxis1 component (on the X axis):
3.1 Drag the PropetyChangedEvent logical component to the designer from the component palette, and set it in the property inspector: "property changed".Name- select "WDateInput1". in "property changed".Propertyselect "date.Start date".
3.2 Drag the AdvSetProperty logical component to the designer from the component palette, and set it up: Property "set property".Name- select the component that we will change - the "WChartXAxis1" component. Property "set property".Property- select the property of the component to be changed - "axis.interval.Time start". Property "set property".Value- select the component that contains the new value of the time start property - "WPropertyChangedEvent1". Connect WPropertyChangedEvent1 and WAdvSetProperty1 with an arrow.
Now let's configure the behavior when the displayed range on the chart is changed with the mouse, so that this range would be set to the date picker component:
3.3 Select the components WPropertyChangedEvent1 and WAdvSetProperty1, copy them to the clipboard and paste it from the clipboard, move them to the side - we got a copy of the event and actions on events - components named WPropertyChangedEvent2 and WAdvSetProperty2.
3.4 In WPropertyChangedEvent2 we change the value of "property changed".Propertyto "date.End date"
3.5 In WAdvSetProperty2 we change the "set property".Propertyvalue to "axis.interval.Time end"
Now set up an event in a similar way: when a displayed range of the chart's X-axis component changes, these dates would be put in the date picker component.
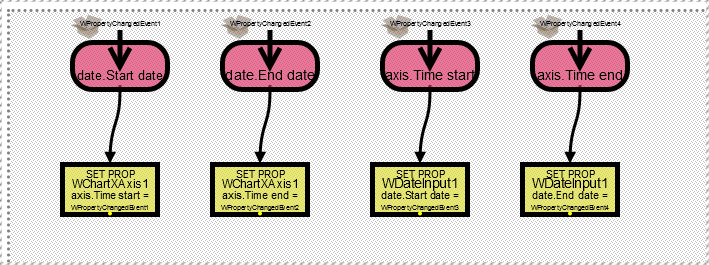
Component' logic designer should look like this
Copy WHistoricChart1 visual component to clipboard and paste it from clipboard, so we get WHistoricChart2, with the same settings. It can be placed below WHistoricChart1. Go into the WHistoricChart2 logic designer and change the properties from the "WChartXAxis1" value to the "WChartXAxis2" value.
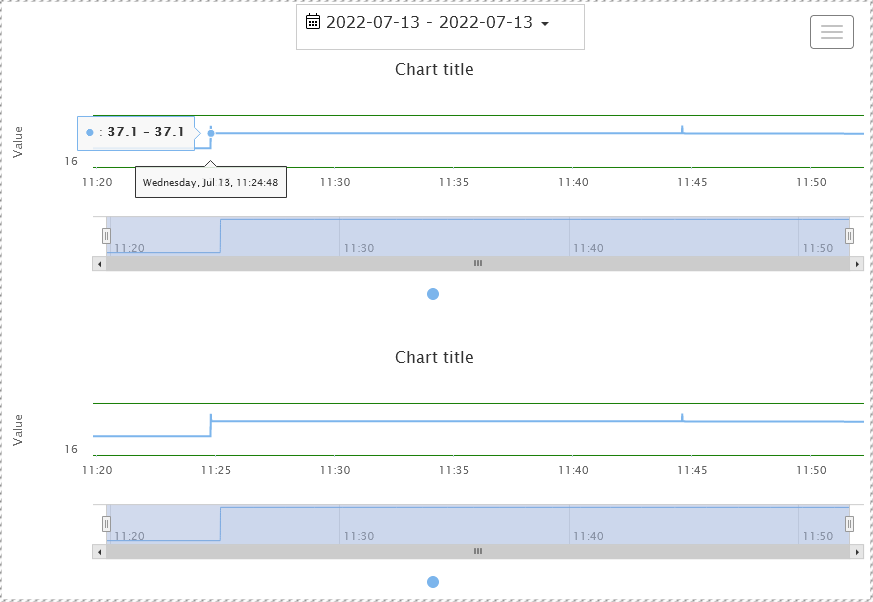
You can run the form and see the result with synchronized charts and a date picker: