Operating mode
Operating mode is intended for use for monitoring purposes. There is only a button that opens the system menu out of the system components, the rest of the view is created completely at the configuration stage.
After switching to operating mode:
- If a default project is set for the user, then the main form of this project is opened.
- If there is no main form, then a list of forms for the user will be shown.
- If the default project is not set for the user, then a list of projects available for the user will open.
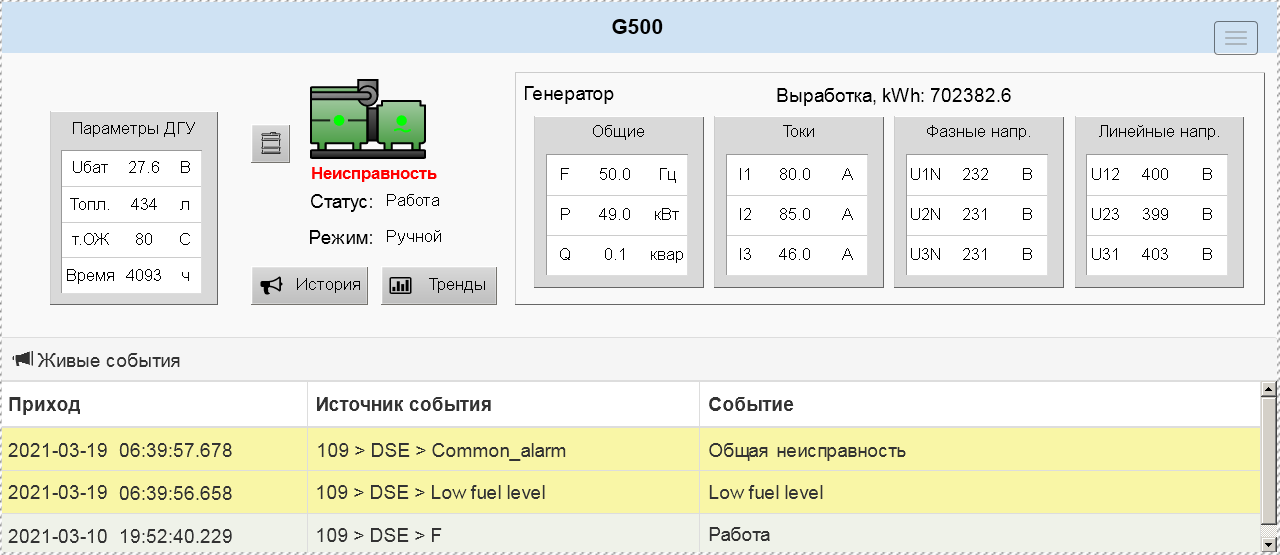
An example of a configured view:
System menu

The menu allows you to perform the following functions
- Go to the home screen (in operating mode).
- Switch to configuration mode (if available).
- View (and change) profile data (if available).
- Exit the monitoring system.
Data update
The data from the equipment is collected by "data sources" and "data sources" transmit this data via the internet to the Webdata.live monitoring servers, from where it is sent to the client browsers. Data on "form" (mimic diagram) is only displayed in browser when the data source from which the data comes is connected to the monitoring server.
If the data source is not connected to the server, then all measurements coming from it on the mnemonic will have the form:
N/A.
That is, Not Available. If the data source is connected to the server, all relevant measurements will be shown again. However, if the data source itself cannot read the correct data from the target equipment (e.g. no communication with the target equipment), even if the data source is connected to the monitoring server, N/A will also be displayed. Another exception is live events - they are displayed in the event log even if the data source is not online.
Pop-up messages
When datasource disconnects, the pop-up indicator "Datasource name" is offline is displayed for a few seconds.

When datasource connects to the server, the "Datasource name" is online pops up for a few seconds.

When sending a control command, or setting a value in a remote device, progress and result of the operation may also be shown with a pop-up message (depending on the setting in the mnemonic configuration).
Same indicators may appear if the project configuration has changed. For example in case when Administrator updated the form, or datasource configuration was updated, a similar message will be displayed informing about the reasons and necessity of refreshing the monitoring page.
Under some conditions of service usage, for example if the data source is on a free plan, a pop-up message may appear informing the user that the limit for saving data to the database from the data source or for displaying data on the form has been reached.
All of the above messages are also duplicated in the event log as "system events".