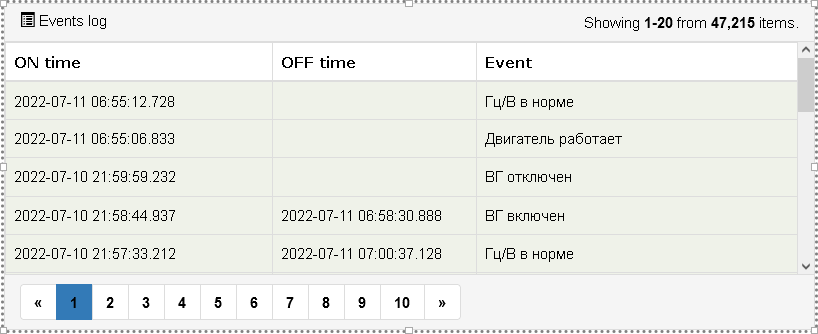
Form designer: Events log visual component
The component is designed to display a list of events in a tabular form. The events themselves are configured separately, on the data source page, when configuring tags.

The component works in two modes ("events".Mode setting):
- "Historic events" - displaying the history of events. In this mode pagination is available, new events are not automatically added to the log.
- "Live events" - display of "live" events. A "live" is that which is not yet completed, or which is completed, but requires acknowledgment and has not yet been acknowledged. In this mode, there is no pagination - all live events are displayed at once, new events can be automatically added to the log.
By default, the component displays all available events from all data sources of the project. But you can use filters that will narrow down the result: the "filters".Filters count property - sets the number of filters used (from 0 to 8). Filters are combined with each other by "or". Each filter defines a set of criteria that must be met at the same time in order for the event to be displayed in the log.
Filter properties:
- "filters"."filter N".
Minimum level- minimum level of the event ("System", "Event", "Warning", "Alarm" , "Critical"). - "filters"."filter N".
Unacknowledged- if "true" is selected - only unacknowledged events should be logged. Can be empty - then this criterion is not taken into account. - "filters"."filter N".
Datasource- the name of the data source (from the available ones), which is associated with the event. If the field is empty, all available data sources are allowed. - "filters"."filter N".
Deviceis the name of the device tag inside the data source that is associated with the event.
Also, for the historical event log in the "filters".Live events property, you can either enable "show" or disable "hide" display of live events. And in the "events".Rows per page property, set the number of displayed records per page.
For the log in live events mode, in the "events".Sort events property, you can configure sorting when displaying events:
- "by id" - events will be displayed in the log in the order of their occurrence, the most recent events at the top of the log.
- "by priority+id" - events will be sorted by priority and time of occurrence, the most critical and the latest events will be at the top of the log.
Appearance
The component is a table with the following elements: a header, a row of column names, a main table, pagination buttons at the bottom of the table. The journal itself consists of a series of columns:
- "ON time" (arrival time) - date-time of occurrence of the event (year-date-day hh:mm:ss.ms).
- "OFF time" - date-time of event disappearance (in the same format).
- "Event Source" - data source > device name in data source > tag name.
- "Event" (event) - the text of the event, as specified when configuring the event (or system text, in the user's language, in case of a system event).
- "Acknowledgment" - If the option "event needs acknowledgment" was set for an event, during configuration, then information about acknowledgment will be displayed in this column for such event: either a button for acknowledging the event by the operator can be displayed, or information about the fact of event acknowledgment will be found.
The table header, a number of column names and each individual column can be hidden (with the exception of the event text column) by selecting the "false" value for the Visible properties of the respective groups.
For the table header and column names, system texts in the user's language are used. They can also be overridden by setting custom values for the Title properties of the respective groups.
Fonts of table elements can be configured in the corresponding subgroups of the "fonts" group: "header panel font", "header font", "main font", "footer font".